

Video: Building Fast Agentic Analytics with Google Antigravity and Rill


How to Use Rill Data with Google Antigravity: Agent-Powered BI in Action
Modern business intelligence is evolving fast — and the combination of Rill Data + Google Antigravity shows exactly where it’s headed. In this walkthrough, we explore how developers and data teams can use AI agents to build, modify, and scale analytics workflows entirely in code.
This isn’t just faster BI — it’s agent-native BI.
What Makes Rill Data Different?
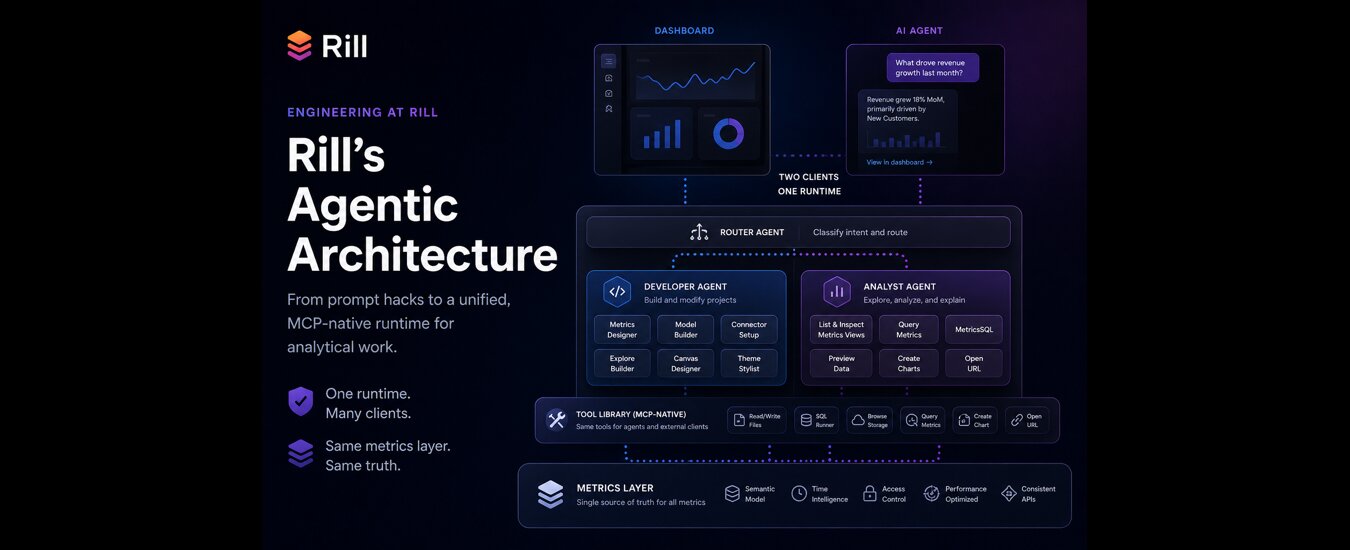
Rill Data is designed as the fastest BI tool for both humans and agents, combining:
- A code-first data model
- A real-time data exploration interface
- Built-in dashboarding (canvas + exploratory)
- Native compatibility with AI coding agents
Because everything is defined in code, agents can understand, modify, and extend your analytics stack just like a developer would.
Getting Started with Rill in Antigravity
Using Google Antigravity, you can spin up a Rill project in minutes:
- Initialize a project with
rill init- Install agent-friendly instructions (
AGENTS.md) - Open the workspace in Antigravity
- Start Rill in cloud preview mode:
rill start --previewThis gives you a live replica of your production environment, including:
- Metrics definitions
- Dimensions and measures
- Logging and observability
- Real-time UI preview
The key advantage: you can edit in code while instantly seeing results.
Agent-Powered Metric Creation
One of the most powerful workflows is using an agent to modify your data model.
For example, adding a new metric:
“Add a CPC (cost per click) metric to the bids view.”
The agent will:
- Read Rill’s project structure
- Analyze existing metrics
- Infer the correct formula
- Update the metrics definition in code
Within seconds, your dataset evolves — from 13 measures to 14 — with:
- Proper naming
- Descriptions
- Formatting (e.g., currency)
No manual dashboard editing. No UI clicking. Just intent → execution.
Instant Data Exploration (No Dashboard Required)
Rill eliminates the need to build dashboards just to explore data.
As soon as your metrics exist, you get:
- A fully interactive data explorer
- Automatic grouping of dimensions and measures
- Real-time filtering and slicing
This is especially powerful when combined with agents — you can iterate on your model and explore instantly.
Canvas Dashboards: Curated Analytics at Scale
For more structured reporting, Rill offers canvas dashboards — fully customizable layouts defined in code.
Here’s where agents really shine.
Example prompt:
“Add the CPC metric to the executive overview.”
The agent:
- Reads dashboard layout code
- Identifies appropriate components
- Updates KPI grids and tables
- Ensures consistency across views
Result:
- CPC appears in both summary KPIs and tabular breakdowns
- No manual wiring required
This makes it incredibly easy to:
- Maintain dozens of dashboards
- Standardize analytics across teams
- Ship updates at scale
Beyond Data: UI and Branding Changes
Agents aren’t limited to metrics — they can also handle presentation.
For example:
“Add a logo to the top left.”
The agent determines:
- Where the UI config lives
- How to inject the asset
- How to maintain layout integrity
This means you can:
- Customize themes
- Apply branding
- Adjust layouts
all through simple natural language commands.
Version Control and Review
Every change made by the agent is:
- Reflected in code
- Reviewable before acceptance
- Ready for version control
This enables:
- Full auditability
- Team collaboration via Git
- Safe iteration with rollback support
Why This Matters: The Future of BI
The Rill + Antigravity workflow demonstrates a major shift:
From:
- Manual dashboards
- Rigid BI tools
- Slow iteration cycles
To:
- Agent-driven analytics
- Code-defined data systems
- Real-time feedback loops
This unlocks:
- Faster experimentation
- Easier scaling
- Lower barrier to advanced analytics
.svg)


Ready for faster dashboards?
Try for free today.